Human Activity Recognition with Smartphones by Logistic Regression
Check out the code here: github.com/ilkecandan/Human-Activity-Recogn.. Dataset: archive.ics.uci.edu/ml/datasets/Human+Activ..
Introduction
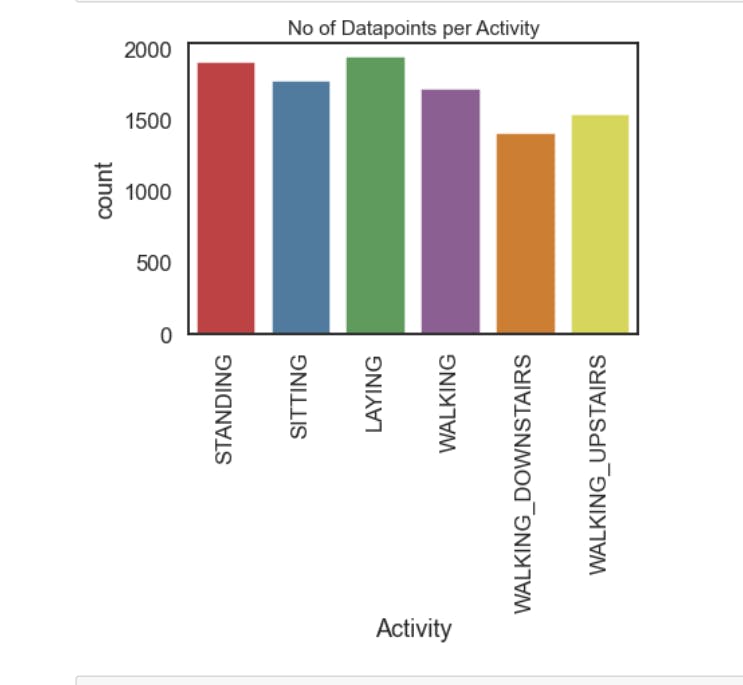
By monitoring someone's daily behaviors, humans may learn about that person's personality and psychological condition. Following this pattern, researchers are actively researching Human Behavior Recognition (HAR), which aims to anticipate human behavior using technology. One of the crucial areas for research in computer vision and machine learning is now this. In this project, we make use of the Human Activity Recognition with Smartphones database. This database was created from recordings of research participants who utilized an inertial sensor-equipped smartphone while carrying out tasks of everyday living. The goal is to group the participant's actions into one of the following six categories: sitting, standing, lying, climbing upstairs, and walking downstairs.
Each entry in the collection has the following details: -Estimated body acceleration and the total triaxial acceleration from the accelerometer
- Gyroscope-derived triaxial angular velocity
- a 561-feature vector containing variables in the time- and frequency-domain -Label for each activity
Problem Definition and Algorithm
The UCI machine learning repository is where the dataset was obtained The collection includes data from 30 participants who were between the ages of 19 and 48. Each participant completes six tasks: • Walking • Walking upstairs • Walking downstairs • Sitting • Standing • Laying

The dataset therefore contains six labels to predict. 561 feature vectors with time- and frequency-domain variables make up the dataset. These traits result from the following information: • Acceleration due to gravity along the x, y, and z axes Body gyroscope data files for the x, y, and z axes as well as body acceleration data files
We will use Logistic Regression to solve this problem.
What is Logistic Regression?
When a dependent variable is dichotomous, the proper regression approach to use is logistic regression (binary). The logistic regression is a predictive analysis, much as all regression analyses. To describe data and explain the connection between one dependent binary variable and one or more independent nominal, ordinal, interval, or ratio-level variables, we employ logistic regression.
Experimental Evaluation
First of all, our only "object" value is the "activity" section. And, sparse matrices won't be accepted by Scikit Learn classifiers for the prediction column. So, LabelEncoder must be used to turn the activity labels into integers. Also, the resultant matrix must be turned into a non-sparse array if DictVectorizer is employed. We will fit the "Activity" column using LabelEncoder, then examine 5 random values.
We should check out the correlation between values. And we see that the correlation between x and y is the same as the correlation between y and x. As a result, the whole bottom half of our matrix, including these values s not providing us with any new information. Because we already know that every single value will be in perfect connection with one another. So we want to remove these values. We will simplify by emptying all the data below the diagonal
We should separate the data into sets for training and testing. You may accomplish this using any technique. Keep the same ratio of predictor classes, think about using Scikit-StratifiedShuffleSplit. ShuffleSplit and StratifiedKFold are combined to create StratifiedShuffleSplit. When using StratifiedShuffleSplit, the distribution of class labels between the train and test datasets is nearly equal.
We're going to specify L1 and the various C values in LogisticRegressionCV; the hyperparameters that we typically want to go at are the various sorts of penalties. C is identical to Lambda except that it is the opposite here. In order to look at the documentation, we'll suppose that Cs equals 10, which is merely going to be the default.
Conclusion
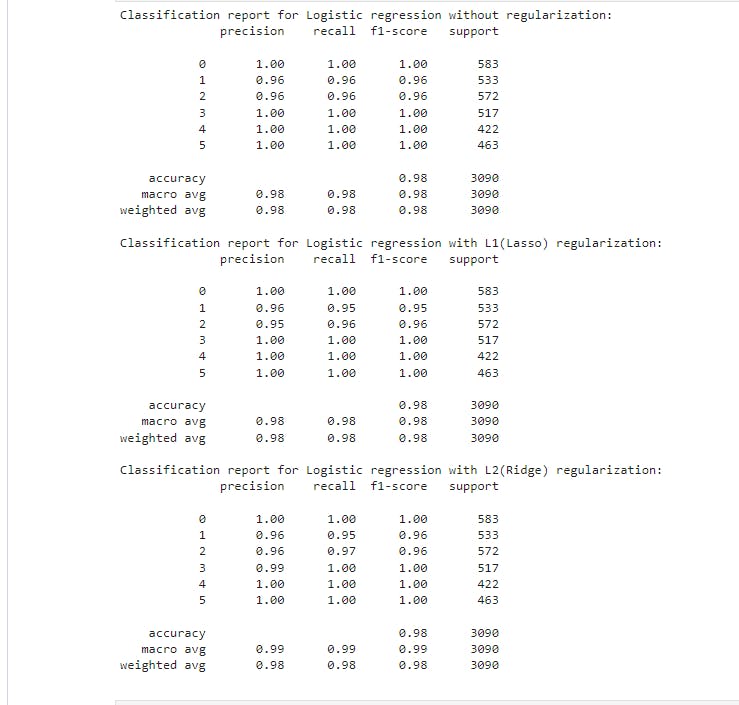
The achieved result shows that the Logistic Regression is quite accurate.

